LOGICOVERFLOW Register
Starts Fri, 16 Oct 2026Online liveMarathi mediumOnly 30 seats

Data Analytics using NumPy, Pandas& Matplotlib

A 5-month live batch for working professionals, with Python, SQL, Statistics and Docker: the common foundation for Data Analyst, Data Engineer and Data Scientist careers. You finish with three projects on your GitHub.

ScheduleMon, Wed, Fri
Time9:30–10:30 PM IST
Sessions58 live, incl. 8 labs
CompletionMarch 2027

Built for people switching careers while working

No prior coding needed: Python is taught from scratch. Classes are late evening, recorded, and taught mainly in Marathi, with Hindi and English where needed.

This batch is for you if

  • You're a working professional (IT or non-IT) planning a move into data roles
  • You're a tester, support engineer, developer or Excel/MIS user who wants real data skills
  • You can give 3 live hours plus 3–4 practice hours every week
  • You want a portfolio of real projects, not just a certificate

What this batch is not

  • Not a complete Data Engineering course: Spark, Airflow and cloud come next
  • Not a Machine Learning course: scikit-learn and ML come next
  • Not a placement guarantee: you get the skills, projects and interview preparation
  • Not a shortcut: consistent practice is what makes it work

Your learning path

Nine modules, each building on the previous one. A hands-on lab follows about every six sessions.

M0Orientation & Setup~Oct 2026
M1Python for Data~Oct – Nov 2026
M2Mathematics for Data + NumPy~Nov 2026
M3Data Wrangling with Pandas~Nov – Dec 2026
M4Visualisation & Storytelling~Dec 2026 – Jan 2027
M5Statistics & Probability~Jan 2027
M6SQL with PostgreSQL~Jan – Feb 2027
M7Docker for Data~Feb 2027
M8Capstone & Career~Mar 2027

Curriculum, session by session

Tap a module to see every session. Mathematics, Statistics, SQL and Docker are all covered, each applied in Python.

M0Orientation & SetupData careers, tools, Git & GitHub2 sessions
~Oct 2026

Understand the three data careers, set up a professional toolkit, and learn the GitHub workflow used to submit every project. Led by Ramdas Sir.

  1. S01
    Welcome to Data Careers & Your Toolkit

    Data Analyst vs Data Engineer vs Data Scientist: day-to-day work, skills and hiring expectations; How this batch runs: live classes, practice sets, projects, doubt support; Install Python (Miniconda), VS Code and Jupyter; your first notebook

  2. S02
    Git & GitHub for Data Professionals

    Repositories, commits, push/pull, .gitignore and branches (basics); Writing a professional README in Markdown; Setting up your GitHub profile; how projects will be submitted and reviewed

M1Python for DataJust the Python you need for data7 sessions
~Oct – Nov 2026

Learn exactly the Python you need for data work: no prior coding required. Every session ends with practice problems. Led by Ramdas Sir.

  1. S03
    Python Basics

    Variables, data types, operators and expressions; Input/output and f-strings; How Python runs code; writing clean, readable code

  2. S04
    Strings & Type Conversion

    String methods for cleaning text: strip, split, replace, lower/upper; Indexing and slicing; Converting between types; common conversion errors

  3. S05
    Lists, Tuples & Sets

    Creating, slicing and modifying lists; Tuples and sets: when to use which; List comprehensions for quick transformations

  4. S06
    Dictionaries, Conditions & Loops

    Dictionaries and nested data; working with JSON-like records; if/elif/else and logical operators; for/while loops, enumerate, zip, break/continue

  5. S07
    Functions & Modules

    Defining functions; parameters, return values, *args/**kwargs; lambda, map and filter; Importing modules, pip and virtual environments

  6. S08
    Files, Errors & Dates

    Reading and writing CSV and JSON files; Exception handling with try/except/finally; datetime basics; mini-exercise: analyse a CSV by hand (and see why Pandas exists)

  7. S09
    Hands-on Lab 1: Python PracticeLab

    Guided problem-solving on strings, collections, loops and functions; File-handling exercises with real CSV/JSON files; Doubt clearing on Module 1

M2Mathematics for Data + NumPyBusiness maths, linear algebra, fast arrays7 sessions
~Nov 2026

Build the practical mathematics behind data work and apply it immediately with NumPy's fast arrays. Led by Ramdas Sir.

  1. S10
    Maths I: Numbers for Business Data

    Percentages, percentage change, ratios and proportions; Growth rates and CAGR; weighted averages; Summation (sigma) notation; rounding and precision

  2. S11
    Maths II: Algebra, Functions & Logarithms

    Functions and graphs; linear equations, slope and intercept; Exponents and logarithms; why log scales matter; Sets and Boolean logic: the maths behind filters and joins

  3. S12
    NumPy I: Arrays

    ndarray: creation, dtype, shape and reshape; Indexing, slicing and boolean masks; Array vs list: speed and memory

  4. S13
    Maths III: Linear Algebra & Calculus Intuition

    Vectors and matrices; shape, transpose, dot product and matrix multiplication; A dataset as a matrix: rows, features and observations; Rate of change and minima: the intuition behind how ML models learn

  5. S14
    NumPy II: Vectorisation & Broadcasting

    Vectorised operations and ufuncs; Broadcasting rules; Aggregations along axes: sum, mean, std, argmax

  6. S15
    NumPy III: Random, Linear Algebra & Missing Values

    Random numbers and simple simulations; Matrix operations with @ and np.linalg; Handling NaN; performance tips

  7. S16
    Hands-on Lab 2: Maths & NumPyLab

    Business-maths problems solved in Python; NumPy array exercises: masks, broadcasting, aggregations; Doubt clearing on Module 2

M3Data Wrangling with PandasLoad, clean, reshape and summarise data10 sessions
~Nov – Dec 2026

Master the everyday toolkit of every data role: load, clean, reshape, combine and summarise real-world data. Led by Ramdas Sir.

  1. S17
    Series & DataFrames

    Reading CSV, Excel and JSON; Inspecting data: head, info, describe, dtypes; Understanding the index

  2. S18
    Selecting & Filtering

    loc and iloc; boolean filtering and query(); Sorting and ranking; Creating and modifying columns

  3. S19
    Data Cleaning I

    Missing values: detect, drop or fill; Duplicates and type conversions; Text cleaning with the .str accessor

  4. S20
    Data Cleaning II

    Detecting and treating outliers; Categorical data, replace and map; apply(); binning with cut and qcut

  5. S21
    Hands-on Lab 3: Data CleaningLab

    Clean a messy real-world dataset step by step; Pair-review of cleaning decisions; Doubt clearing

  6. S22
    GroupBy & Aggregation

    Split-apply-combine; agg with multiple functions; named aggregations; transform and filter on groups

  7. S23
    Combining & Reshaping

    merge, join and concat (with SQL analogies); pivot_table, melt and crosstab; Avoiding duplicate rows after merges

  8. S24
    Time Series

    Parsing datetimes; the .dt accessor; resample, rolling windows and shift; Month-on-month and year-on-year comparisons

  9. S25
    Pandas Best Practices

    Method chaining and readable pipelines; Memory optimisation and reading large files in chunks; Writing to CSV, Excel and Parquet · Minor Project 1 released

  10. S26
    Hands-on Lab 4: Pandas + Minor Project 1 Work SessionLab

    End-to-end Pandas exercise; Start Minor Project 1 with mentor guidance; Repository setup and README checklist

M4Visualisation & StorytellingCharts and one-page data stories5 sessions
~Dec 2026 – Jan 2027

Turn analysis into clear, honest charts and one-page reports that decision-makers understand. Led by Ramdas Sir.

  1. S27
    Matplotlib Fundamentals

    Anatomy of a figure: Figure and Axes (object-oriented API); Line, bar, scatter and histogram; Plotting directly from Pandas

  2. S28
    Customising Charts

    Titles, labels, annotations, colours and styles; Subplots and dual axes; Exporting high-resolution images

  3. S29
    Seaborn Quick Wins

    Distribution plots, box and violin plots; Heatmaps and correlation matrices; Pair plots for exploring relationships

  4. S30
    Data Storytelling

    Choosing the right chart for the question; Decluttering and highlighting the insight; Building a one-page analysis report; common charting mistakes

  5. S31
    Minor Project 1: Review & Showcase

    Selected participants present their EDA; Mentor feedback on code, charts and README; Common mistakes and how to fix them

M5Statistics & ProbabilityProbability, testing and A/B experiments7 sessions
~Jan 2027

Learn the statistics used to make decisions from data, with every concept demonstrated in Python (NumPy, Pandas, SciPy). Led by Neha Ma'am.

  1. S32
    Descriptive Statistics

    Types of data; mean, median and mode; Variance, standard deviation, percentiles and IQR; Skewness, outliers and box plots

  2. S33
    Probability

    Sample spaces, events and probability rules; Conditional probability and independence; Bayes' theorem intuition with real examples

  3. S34
    Probability Distributions

    Binomial and Poisson distributions; Normal distribution, z-scores and the empirical rule; Simulating distributions with NumPy

  4. S35
    Sampling & Estimation

    Populations vs samples; sampling bias; Central Limit Theorem and standard error; Confidence intervals and bootstrapping

  5. S36
    Hypothesis Testing

    Null and alternative hypotheses; p-values; Type I and II errors; t-tests and chi-square tests with SciPy; Interpreting results in plain business language

  6. S37
    Correlation & A/B Testing

    Covariance; Pearson and Spearman correlation; Correlation vs causation; simple linear regression intuition; Designing and analysing an A/B test end to end

  7. S38
    Hands-on Lab 5: StatisticsLab

    Descriptive stats and distributions on real data; Run and interpret hypothesis tests with SciPy; Doubt clearing on Module 5

M6SQL with PostgreSQLFrom SELECT to window functions11 sessions
~Jan – Feb 2027

Write the SQL that analysts and engineers use daily, from basic queries to window functions and schema design. Led by Ramdas Sir.

  1. S39
    Relational Databases & First Queries

    Tables, rows, keys and schemas; installing PostgreSQL and pgAdmin; CREATE, INSERT and data types; SELECT, WHERE, ORDER BY and LIMIT

  2. S40
    Functions & Conditional Logic

    String, date and numeric functions; CASE WHEN; NULL handling with COALESCE; DISTINCT

  3. S41
    Aggregation

    COUNT, SUM, AVG, MIN and MAX; GROUP BY and HAVING; Business KPIs in SQL

  4. S42
    Joins

    INNER, LEFT, RIGHT, FULL, SELF and CROSS joins; Join pitfalls: fan-out and duplicate counts; Multi-table business questions

  5. S43
    Hands-on Lab 6: SQL ILab

    Query practice: filtering, aggregation and joins; Business questions on a sample database; Doubt clearing

  6. S44
    Subqueries, CTEs & Set Operations

    Scalar, correlated and IN/EXISTS subqueries; Common Table Expressions (WITH); UNION, INTERSECT and EXCEPT

  7. S45
    Window Functions I

    OVER and PARTITION BY; ROW_NUMBER, RANK and DENSE_RANK; Top-N per group

  8. S46
    Window Functions II

    LAG and LEAD; period-over-period change; Running totals and moving averages; Cohort and retention analysis

  9. S47
    Design, Performance & SQL from Python

    Keys, normalisation (1NF-3NF) and an intro to star schemas; Indexes, EXPLAIN and views; Querying from Python with SQLAlchemy and pandas.read_sql · Minor Project 2 released

  10. S48
    Hands-on Lab 7: SQL II + Minor Project 2 Work SessionLab

    Window-function and CTE practice; Start Minor Project 2 with mentor guidance; Loading data into PostgreSQL

  11. S49
    Minor Project 2: Review & Showcase

    Selected participants present their SQL analysis; Review of query quality, correctness and statistical reasoning; SQL interview-style problem walkthrough

M7Docker for DataPostgres in containers, connected to Python4 sessions
~Feb 2027

Run databases and data scripts in containers, and connect Python to a containerised PostgreSQL. This is the bridge to data engineering. Led by Ramdas Sir.

  1. S50
    Docker Fundamentals

    Why containers; images vs containers; Docker Desktop setup (WSL2 on Windows); run, ps, logs, exec; ports and volumes

  2. S51
    PostgreSQL + pgAdmin in Docker

    Running Postgres in a container with persistent volumes; Environment variables and configuration; docker-compose.yml for a multi-service setup

  3. S52
    Connecting Python to Containerised Postgres

    SQLAlchemy / psycopg connections; secrets in .env; Loading DataFrames with to_sql; reading back with read_sql; A Dockerfile for a Python ETL script · Major Project released

  4. S53
    Hands-on Lab 8: DockerLab

    Everyone gets Postgres + pgAdmin running in Docker; Troubleshooting on Windows/WSL2, macOS and Linux; Connect Python to the container and load a DataFrame

M8Capstone & CareerCapstone labs, portfolio and interviews5 sessions
~Mar 2027

Build the major project with mentor support, present it, and prepare to apply for data roles. Led by Ramdas Sir.

  1. S54
    Capstone Lab I: ETL & Data Quality

    Extract, validate and clean the chosen dataset; Data-quality checks and logging; Loading into PostgreSQL

  2. S55
    Capstone Lab II: Analysis Layer

    SQL views and analysis tables; Statistical analysis of the key question; Report charts

  3. S56
    Portfolio & Personal Branding

    Writing a README that recruiters read; A resume for career switchers; LinkedIn and GitHub profile; Telling your project story in an interview

  4. S57
    Interview Preparation & Roadmap

    Python, Pandas, SQL and statistics interview questions; Group mock-interview practice; Next steps: roadmap to Data Engineer (Spark, Airflow, cloud) and Data Scientist (scikit-learn, ML)

  5. S58
    Capstone Demo Day

    Participants present their end-to-end projects; Final feedback; Certificates and the way forward

Months are approximate. The session schedule is shared in the batch group, and any changes are announced in advance. Download the full syllabus (PDF)

Three projects you push to GitHub

Each project is a public repository with clean code, a clear README and reproducible setup, reviewed by your mentors.

Minor project 1 · after Pandas & Visualisation

Retail sales exploratory data analysis

Clean a messy real-world retail dataset and turn it into clear business insights.

  • Handle missing values, cancellations, duplicates and wrong types
  • Analyse products, seasonality and repeat customers
  • 8–10 publication-quality charts and 5 recommendations
PandasNumPyMatplotlibSeaborn
Minor project 2 · after Statistics & SQL

E-commerce SQL analytics & hypothesis testing

Load a multi-table e-commerce database into PostgreSQL and answer real business questions.

  • 15 business questions using joins, CTEs and window functions
  • Cohort retention and RFM customer segments
  • Test a hypothesis in Python, e.g. do late deliveries lower review scores?
PostgreSQLSQLAlchemySciPy
Major project · capstone, Demo Day in March 2027

End-to-end Dockerised data pipeline & analytics report

Build a small but real data system that anyone can run with two commands, on a public dataset you choose with mentor approval.

Raw data›Python ETL›PostgreSQL in Docker›SQL views›Statistical analysis›Report
  • docker-compose stack with PostgreSQL and pgAdmin
  • ETL script with data-quality checks and logging
  • Analysis and charts answering one meaningful question
DockerPython ETLSQLStatisticsGit

Everything included in one fee

No hidden add-ons.

58 live sessions

60-minute classes with live coding, including 8 hands-on labs.

Session recordings

Every class is recorded and shared, so you can catch up anytime.

Practice sets

Assignments after every session to build real fluency.

3 reviewed projects

Two minor and one major GitHub project, reviewed by your mentors.

Doubt support

A batch community group for questions between classes.

Certificate & career prep

Certificate of completion, resume and GitHub guidance, and interview practice.

Your mentors

Ramdas Sir leads the batch and teaches every module except Statistics, which Neha Ma'am teaches.

Prof. Ramdas Biradar
Lead mentor

Prof. Ramdas Biradar

14+ years teaching

MCS, BCS. 5,000+ students trained. Python, SQL, C, Java and DSA. Known on Instagram as @logic_overflow.

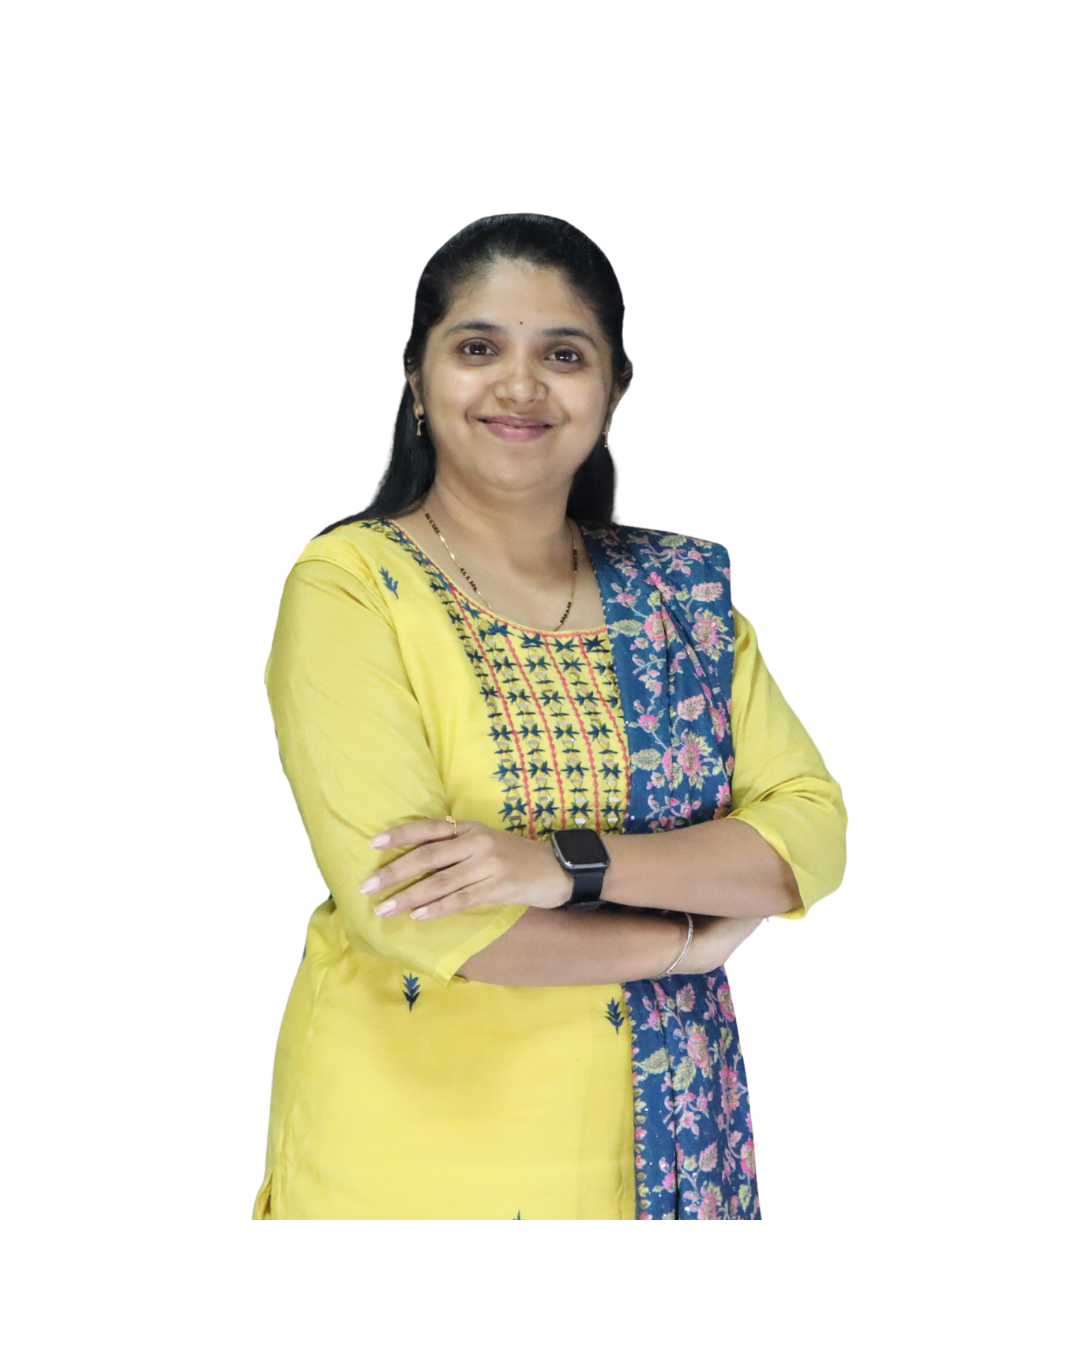
Prof. Neha Biradar
Co-mentor, Statistics

Prof. Neha Biradar

14+ years teaching

MCS, BCS. Mathematics, Statistics, Python, C, C++ and Java. Teaches the Statistics & Probability module.

Fees

The fee switches to regular automatically when the early-bird timer ends. Seats are first-come, first-served.

Open now

Early-bird

₹15,999

First 15 registrations or until Sunday, 4 Oct 2026, 11:59 PM IST, whichever comes first.

00days
00hrs
00mins
00secs
Register at ₹15,999
Opens after early-bird

Regular

₹17,999

After the early-bird closes, until all 30 seats are filled. Batch starts Friday, 16 Oct 2026 at 9:30 PM IST.

00days
00hrs
00mins
00secs

Time until the batch starts

Available after early-bird

Before you join

  • Laptop: Windows 10/11 (64-bit), macOS or Linux
  • 8 GB RAM minimum (16 GB recommended) and 20 GB free disk space for Docker
  • Stable internet connection
  • 3–4 hours a week for practice outside class

Policies

  • Admissions close when all 30 seats are filled
  • Fees are non-refundable and non-transferable
  • If Logic Overflow cancels or postpones the batch, you get a full refund
  • Schedule changes are announced in the batch group in advance

Common questions

Do I need to know coding already?

No. Module 1 teaches the Python you need for data from scratch. Plan for 3–4 hours of practice every week alongside the classes.

Which language is the batch taught in?

Mainly Marathi, with Hindi and English where needed. Technical terms and code are in English, as they are at work.

What if I miss a class?

Every session is recorded and shared. Watch it, do the practice set, and ask doubts in the batch group.

How long is the batch?

About 5 months: 58 live sessions of 60 minutes on Monday, Wednesday and Friday, starting 16 October 2026 and completing in March 2027, including breaks for Diwali, Christmas and New Year.

Will this make me a Data Engineer or Data Scientist?

It prepares you for Data Analyst roles and builds the foundation both of those careers need. For Data Engineering you'd add Spark, Airflow and cloud; for Data Science, machine learning. The final module gives you a clear roadmap for either path.

Is placement guaranteed?

No. You get job-relevant skills, three GitHub projects, resume and profile guidance, and interview practice. We don't promise jobs.

How does the early-bird offer work?

The ₹15,999 fee applies to the first 15 registrations or until Sunday, 4 October 2026, 11:59 PM IST, whichever comes first. After that the fee is ₹17,999.

Can I get a refund or transfer my seat?

Fees are non-refundable and non-transferable. The only exception: if Logic Overflow cancels or postpones the batch, you get a full refund.

What happens after I pay?

Ramdas Sir will contact you on WhatsApp with the joining details and the batch group link before the first class.

Start your switch into data on 16 October

Only 30 seats. Early-bird ends Sunday, 4 October at 11:59 PM IST.

Register now
₹15,999
Early-bird ends in --
Register